Optimization ROI gets argued with vibes, because the waste is invisible. Here are the four places the value actually shows up (drive time, planning time, capacity, cost mix), the four operational factors that decide how big each one is for you, and how we now calculate the number for a specific operation instead of quoting an industry average.

A scheduler sits down on Friday afternoon with 30 patient visits and one therapist to route them to. There are roughly 2.6 x 10^32 ways to order those visits. If she could evaluate a billion of them every second, she would still be working long after the sun burns out.
She has until 4pm.
She will do what every good scheduler does. She will pick a decent order, check it against the constraints she remembers, and ship it. The plan will be fine. It will also leave money on the table, and nobody in the building will ever know how much.
That last part is the real problem with optimization ROI. The waste is invisible, so the business case gets argued with vibes.
Here is the honest version, in four parts, plus how we now put a real number on it for a specific operation instead of a generic one.
Ask a routing vendor what you will save and you will usually get one percentage. Treat that number as marketing, including when it comes from us.
The real answer depends on four things about your operation:
Two field service companies with identical technician counts can land in completely different places on the same optimization project. A single percentage does not survive that.
So the four areas below are where the value comes from. What it is worth to you is a calculation, and we will get to that.
This is the one everyone expects, and it is real.
Against an experienced, talented human scheduler, we typically see drive time drop by around 15%. Against an average one, closer to 30%. In some operations we have seen up to 50%.
One of our last mile delivery customers runs 47 couriers on OnRoute and cut total drive time by 23%.
The gap is not intelligence. It is search volume. A constraint-based solver using metaheuristic search evaluates millions of candidate plans in the time a human evaluates three, and it does not get tired at 3:45pm on a Friday.
The second area has nothing to do with fuel.
Scheduling complexity grows faster than headcount. At some point the planning job stops being hard and starts being impossible, and the growth curve flattens against it.
One of Belgium’s leading hospitals went from three days of scheduling work to four hours, a 90% reduction.
The hours are the obvious win. The quieter one is that automation makes schedules consistent, removes a whole class of manual error, and ends the situation where one person going on vacation degrades the plan for two weeks.
Drive time saved is capacity gained, but the exchange rate depends on your job length.
Across deployments, a 20% to 50% drive time reduction generates roughly 5% to 20% additional capacity. A world player in consumer goods saw 35% more daily visits from field sales visit optimization.
If your interventions run under an hour, most of the saved drive time converts into billable work. If a session takes half a day, the same saving mostly buys your people an earlier finish. Both are worth having. They are not worth the same.
This is usually the number the CFO cares about, because extra capacity is revenue rather than cost avoidance.
The fourth area is the one most operators never model.
Resources do not cost the same. A payroll technician, a freelance contractor, and an overtime hour carry different rates and different rules. If your solver treats them as interchangeable, it will happily build the shortest plan and hand you a more expensive one.
Cost belongs inside the model as a constraint, not in a report you read afterward. Once it is in there, the solver builds the cheapest feasible schedule rather than the shortest one. How much that is worth depends entirely on your contract mix, which is exactly why it needs measuring rather than estimating.
Solvice is a managed optimization API. Platforms like Skedulo and Planon, and operators like Swapfiets and De Lijn, send jobs, resources, and constraints over REST and get an optimized plan back. 50+ constraint types, up to 20,000 orders per solve, and real-time re-optimization in under three seconds for when the day falls apart at 10am.
The four areas above are not features. They are the four places the money shows up once the solver is doing the search.
We built the Solvice Optimization Value Calculator for exactly the problem this article opened with.
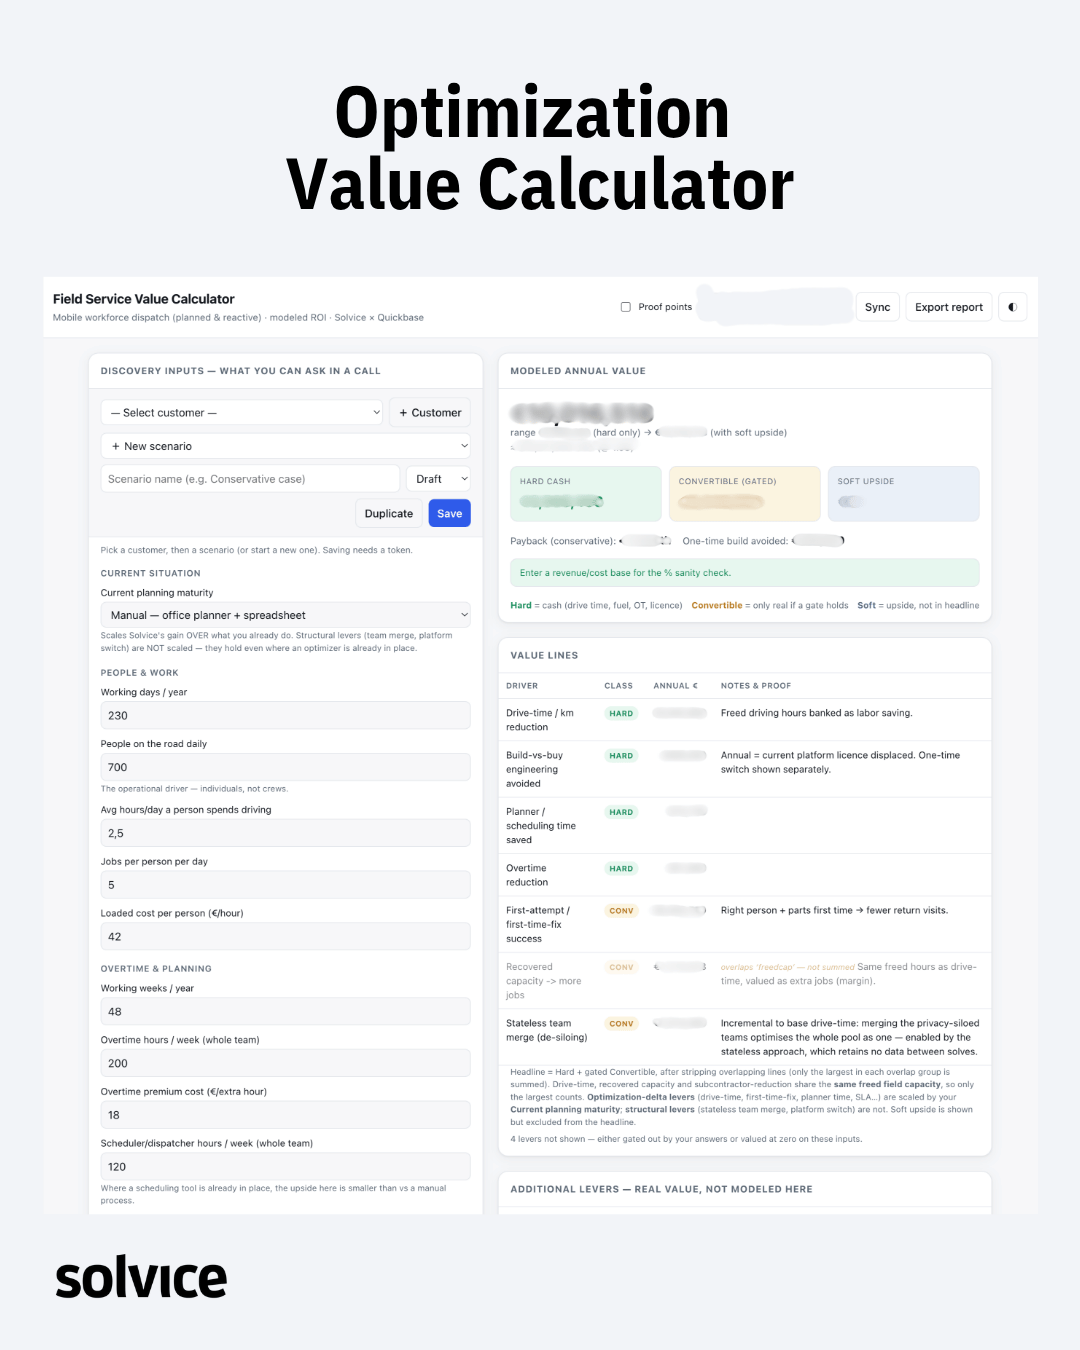
Instead of quoting you a percentage, we work through your operation with you: people on the road, hours a day spent driving, jobs per person per day, loaded cost per hour, overtime, planner hours, first-time-fix rate, contract mix. Those answers go into a value model that returns an annual number for your operation, with every figure traced back to the assumption that produced it. Change an assumption and the number moves in front of you.
The output separates three things most business cases blur together:
Where two levers draw on the same freed hours, only the largest one counts. No double counting. Levers that do not apply to your operation are shown as excluded rather than quietly dropped, and the value we cannot model honestly is listed as exactly that.
It is a model built from discovery inputs, not a measurement, and it is a basis for a conversation rather than a commitment. That is the point. If the number turns out to be small for your operation, you find that out before you buy anything.
The full model needs a conversation. Its largest lever does not.
The ROI calculator now on the site takes five numbers you already know: people on the road, hours a day driving, loaded cost per hour, working days per year, and how you plan today. It returns your recoverable drive-time cost in about a minute. No email, nothing gated.
Bring your result to a 45-minute session and we will build the rest of the model with you: overtime, planner hours, first-time-fix, the capacity you could sell and the licence you might displace, split into hard cash, convertible and soft upside, every line traced back to the assumption behind it.